
Tổng hợp bài viết mẫu Writing IELTS Part 1
Tổng hợp bài viết mẫu Writing IELTS Part 1
“Post Mimi này tổng hợp các bài mẫu Writing IELTS Part 1 giúp bạn dễ dàng tham khảo và nâng cao kỹ năng viết. Nội dung sẽ được mình cập nhật thường xuyên, nên nếu bạn quan tâm, hãy ghé lại thường xuyên để không bỏ lỡ những bài mới nhất nhé!”
Process, Map, Mixed Chart,…
Bài 1
The pictures show the process of making cherry jam.
Describe the process.
Remember to:
-
include an introduction and an overview
-
use the present simple passive
-
use sequencing expressions
-
write 150 words.

The diagram shows how cherry jam is produced from fresh cherries through a series of steps.
Overall, the process consists of nine stages, beginning with harvesting cherries and ending with labeling the jam jars.
To begin with, a sheet is spread under the cherry tree, and the tree is shaken so that the cherries fall onto the sheet. Next, the cherries are collected and transported to the processing plant by truck. At the plant, the leaves and stems are removed before the cherries are thoroughly washed to eliminate dirt and other impurities. After that, the cherries are checked for quality.
In the following stage, the stones are carefully taken out of the cherries. The cherries are then cooked with additional ingredients such as sugar, lemon juice, and pectin. After cooking, the quality of the jam is tested to ensure it meets standards. Once the jam is ready, it is poured into sterilized jars. Finally, labels are attached to the jars to complete the production process.
Từ vựng khó:
| Từ / Cụm từ | Giải thích | Dịch nghĩa tiếng Việt |
|---|---|---|
| consists of | Used to show what something is made up of | Bao gồm |
| harvesting | The act of collecting crops from the field | Thu hoạch |
| processing plant | A factory where raw products are processed | Nhà máy chế biến |
| impurities | Unwanted or dirty substances mixed in something | Tạp chất, bụi bẩn |
| checked for quality | Examined to make sure it meets certain standards | Được kiểm tra chất lượng |
| stones (of cherries) | The hard inner seed of cherries | Hạt trong quả cherry |
| additional ingredients | Extra items added to the main product | Các thành phần bổ sung |
| pectin | A natural substance in fruits that makes jam set | Chất tạo đông tự nhiên (giúp mứt đặc lại) |
| sterilized jars | Glass containers that have been cleaned of germs | Lọ thủy tinh được tiệt trùng |
| labels are attached | Stickers or tags are fixed onto the product | Nhãn mác được dán vào |
Dịch nghĩa:
Sơ đồ cho thấy cách mứt cherry được sản xuất từ những quả cherry tươi qua một chuỗi các bước.
Nhìn chung, quy trình gồm chín giai đoạn trong quá trình làm mứt cherry, bắt đầu từ việc thu hoạch quả và kết thúc bằng việc dán nhãn lọ mứt.
Đầu tiên, một tấm bạt được trải dưới gốc cây cherry và cây được rung lắc để quả rơi xuống tấm bạt. Tiếp theo, những quả cherry được thu gom và vận chuyển đến nhà máy chế biến bằng xe tải. Tại nhà máy, cuống và lá được loại bỏ trước khi quả được rửa sạch hoàn toàn để loại bỏ bụi bẩn và các tạp chất khác. Sau đó, cherry được kiểm tra chất lượng.
Ở giai đoạn tiếp theo, hạt được lấy ra khỏi quả một cách cẩn thận. Sau đó, quả cherry được nấu cùng với các thành phần bổ sung như đường, nước cốt chanh và pectin. Sau khi nấu, chất lượng mứt được kiểm tra để đảm bảo đạt tiêu chuẩn. Khi mứt đã sẵn sàng, nó được rót vào các lọ đã tiệt trùng. Cuối cùng, nhãn mác được dán lên lọ để hoàn tất quy trình sản xuất.
Bài 2
The maps below show Colwick Arts Centre in 2005 and today.
Summarise the information by selecting and reporting the main features, and make comparisons where relevant.
Remember to:
-
write an introductory sentence
-
include an overview
-
use the present simple and past simple, both active and passive
-
use prepositions to explain where things are/were
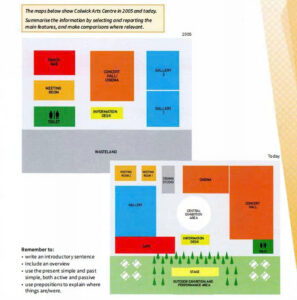
The given maps demonstrate the changes which have taken place in the Colwick Arts Centre between 2005 and the present. Overall, it is clear that the Colwick Arts Centre has witnessed major developments, with the most noticeable changes being the replacement of wasteland with an outdoor exhibition and performance area, and the addition of new facilities. In the middle of the centre, a central exhibition area has been created. The cinema and concert hall, which were originally located in the centre of the building, have now been separated and relocated to the northern part of the centre, with the cinema just above the new central exhibition area and the concert hall positioned in the top-right corner. The meeting room has also been divided into two smaller rooms and relocated from the west to the northwest. Moreover, the old snack bar was demolished and replaced by two meeting rooms, which were previously located in the southwest corner. Additionally, a new drama studio was constructed next to them. Meanwhile, the two galleries in the southeast were combined into a single gallery and relocated to the west side, directly opposite the new meeting rooms. Another major change is that the outside area was developed. In 2005, there was an empty area of land outside the centre. Trees were planted there and an outdoor exhibition area was constructed. The café was moved to the front of the Arts Centre and tables were added outside. Furthermore, the toilet to the west has been reduced in size and moved to the east, just next to the concert hall.
Các từ vựng khó:
| Từ / Cụm từ | Giải thích | Dịch nghĩa tiếng Việt |
|---|---|---|
| demonstrate | Show clearly or explain | Minh họa, cho thấy |
| changes which have taken place | The modifications that happened | Những thay đổi đã diễn ra |
| witnessed major developments | Experienced big improvements or changes | Chứng kiến sự phát triển lớn |
| replacement of wasteland | Substitution of unused land with something else | Việc thay thế đất hoang |
| facilities | Buildings or equipment provided for a particular purpose | Cơ sở vật chất |
| central exhibition area | A main place to display art or items | Khu triển lãm trung tâm |
| separated and relocated | Split and moved to a new place | Tách ra và di chuyển |
| positioned | Placed in a particular location | Được đặt / bố trí |
| divided into | Split into smaller parts | Chia thành |
| demolished | Destroyed, knocked down | Bị phá bỏ |
| constructed | Built | Được xây dựng |
| combined into | Joined together to become one | Gộp lại thành |
| developed (area) | Improved, made better, built up | Được cải tạo, phát triển |
| empty area of land | Land without buildings or structures | Khu đất trống |
| planted (trees) | Put seeds or trees into the ground to grow | Trồng cây |
| moved to the front | Relocated to the front side | Chuyển ra phía trước |
| furthermore | In addition, also | Hơn nữa |
| reduced in size | Made smaller | Thu nhỏ lại |
Dịch nghĩa:
Các bản đồ được cung cấp minh họa những thay đổi đã diễn ra tại Trung tâm Nghệ thuật Colwick giữa năm 2005 và hiện tại.
Nhìn chung, rõ ràng là Trung tâm Nghệ thuật Colwick đã chứng kiến nhiều sự phát triển lớn, với thay đổi đáng chú ý nhất là việc thay thế khu đất hoang bằng một khu triển lãm và biểu diễn ngoài trời, cùng với việc bổ sung thêm nhiều cơ sở vật chất mới.
Ở giữa trung tâm, một khu triển lãm trung tâm đã được xây dựng. Rạp chiếu phim và phòng hòa nhạc, vốn ban đầu nằm ở trung tâm của tòa nhà, hiện đã được tách riêng và chuyển đến phía bắc của trung tâm, với rạp chiếu phim ngay phía trên khu triển lãm trung tâm mới và phòng hòa nhạc được đặt ở góc trên bên phải. Các phòng họp, vốn trước đây nằm ở góc tây nam, đã được di dời. Ngoài ra, một phòng studio kịch mới đã được xây dựng ở phía tây, ngay đối diện với các phòng họp mới.
Một thay đổi lớn khác là khu vực bên ngoài đã được cải tạo. Năm 2005, có một khu đất trống bên ngoài trung tâm. Cây xanh đã được trồng ở đó và một khu triển lãm ngoài trời đã được xây dựng. Quán cà phê được chuyển ra phía trước của Trung tâm Nghệ thuật và bàn ghế được bổ sung bên ngoài. Hơn nữa, nhà vệ sinh ở phía tây đã bị thu nhỏ diện tích và chuyển sang phía đông, ngay cạnh phòng hòa nhạc.
Bài 3
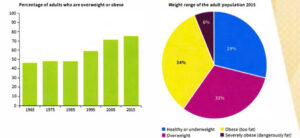
The bar chart shows the percentage of adults who were overweight or obese (too fat or much too fat) in one country from 1965 to 2015. The pie chart shows the proportion of adults who were overweight, obese or severely obese in 2015.
Summarise the information by selecting and reporting the main features, and make comparisons where relevant.
Write at least 150 words.
Từ vựng khó:
| Từ / Cụm từ | Giải thích | Dịch nghĩa tiếng Việt |
|---|---|---|
| illustrates | Describes or shows something clearly | Minh họa, mô tả rõ |
| breakdown (of weight categories) | Detailed division or classification of data | Phân loại chi tiết |
| proportion | Percentage or share of a whole | Tỷ lệ, phần trăm |
| substantially | Considerably, to a large extent | Đáng kể, ở mức lớn |
| minority | A small part of the population | Thiểu số, số ít |
| relatively stable | Remaining almost unchanged, with small variation | Tương đối ổn định |
| fluctuating slightly | Changing up and down a little | Dao động nhẹ |
| surpassing | Going beyond a certain level | Vượt qua |
| approximately | About, nearly | Xấp xỉ |
| dramatic overall growth | A very noticeable and significant increase | Sự tăng trưởng đáng kể |
| categories | Groups or classes | Nhóm, hạng mục |
| severely obese | Extremely overweight | Béo phì nghiêm trọng |
| notable proportion | An amount worth noticing | Tỷ lệ đáng chú ý |
| dangerously high obesity levels | Extremely unhealthy levels of obesity | Mức độ béo phì nguy hiểm |
Dịch nghĩa:
Biểu đồ cột minh họa tỷ lệ người trưởng thành bị thừa cân hoặc béo phì ở một quốc gia trong giai đoạn từ 1965 đến 2015, trong khi biểu đồ tròn cung cấp sự phân loại chi tiết các nhóm cân nặng của người trưởng thành vào năm 2015.
Nhìn chung, có thể thấy rằng tỷ lệ người lớn thừa cân hoặc béo phì đã tăng đáng kể trong suốt 50 năm. Đến năm 2015, hơn hai phần ba dân số rơi vào tình trạng thừa cân hoặc béo phì, chỉ còn một bộ phận nhỏ duy trì cân nặng khỏe mạnh hoặc thiếu cân.
Xét trước tiên biểu đồ cột, vào năm 1965, khoảng 45% người trưởng thành bị thừa cân hoặc béo phì. Con số này duy trì tương đối ổn định cho đến năm 1985, dao động nhẹ trong khoảng từ 45% đến 50%. Tuy nhiên, sau năm 1985, tỷ lệ này tăng đều đặn, vượt quá 60% vào năm 1995 và đạt khoảng 70% vào năm 2005. Đến năm 2015, tỷ lệ này đã tăng lên xấp xỉ 75%, thể hiện mức tăng trưởng mạnh mẽ so với giữa thập niên 1960.
Chuyển sang biểu đồ tròn năm 2015, chỉ 29% người trưởng thành được xếp vào nhóm khỏe mạnh hoặc thiếu cân, trong khi 71% còn lại thuộc nhóm thừa cân hoặc béo phì. Trong số đó, 34% là thừa cân, 31% là béo phì và 6% là béo phì nghiêm trọng. Điều này cho thấy không chỉ phần lớn người trưởng thành bị ảnh hưởng bởi tình trạng thừa cân, mà còn có một tỷ lệ đáng kể đã đạt tới mức béo phì nguy hiểm.
Line Chart
Bài 1
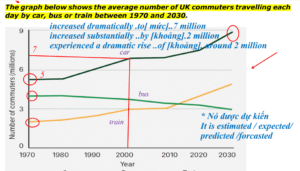
The illustration presents the typical quantity of travellers in the UK using three different means of transportation over a span of sixty years.
Undoubtedly, the automobile is the most preferred option for UK commuters. Although the numbers of people who use the car and train gradually climb, the number of bus users falls steadily.
In 1970, around five million individuals travelled by car on a daily basis, while the other transport modes were used by about 4 million and 2 million people respectively. In the year 2000, the number of those commuting to work climbed to 7 million and the number of railway passengers reached approximately 3 million. However, there was a reduction of approximately 0.5 million in the number of bus users.
By 2030 the number of people who commute by car is projected to reach almost 9 million, and the number of train passengers is also expected to rise to nearly 5 million. Meanwhile, buses are forecast to decline further, with only 3 million commuters.
Từ vựng khó và giải thích:
| Từ vựng | Nghĩa tiếng Việt | Giải thích / Ghi nhớ nhanh |
|---|---|---|
| illustration | hình minh họa | thường dùng để chỉ hình ảnh, sơ đồ, hoặc biểu đồ |
| typical | điển hình, tiêu biểu | nghĩa là đại diện cho một dạng chung |
| quantity | số lượng | khác với “amount” ở chỗ thường dùng cho vật đếm được và không đếm được |
| travellers | hành khách, người đi lại | số nhiều của “traveller” (Anh-Anh), Mỹ viết là “travelers” |
| means of transportation | phương tiện giao thông | “means” ở đây là danh từ số ít & số nhiều giống nhau |
| span | khoảng thời gian | có thể dùng cho thời gian hoặc khoảng cách |
| undoubtedly | không nghi ngờ gì | từ nối nhấn mạnh ý chắc chắn |
| preferred option | lựa chọn được ưa thích | collocation thường gặp trong IELTS |
| commuters | người đi làm xa | chỉ người di chuyển thường xuyên giữa nhà và nơi làm việc |
| gradually | dần dần | trái nghĩa với “suddenly” |
| steadily | đều đặn, ổn định | tốc độ hoặc xu hướng không thay đổi mạnh |
| respectively | lần lượt | cho biết sự tương ứng theo thứ tự |
| commuting | việc đi lại hằng ngày | dạng V-ing của “commute” |
| passengers | hành khách | dùng cho phương tiện công cộng như tàu, xe buýt |
| reduction | sự giảm | danh từ của “reduce” |
| approximately | xấp xỉ, khoảng | tương tự “about” nhưng trang trọng hơn |
| projected | được dự báo | thường dùng cho số liệu tương lai |
| forecast | dự đoán, dự báo | thường dùng cho thời tiết hoặc xu hướng |
| decline | giảm | có thể dùng như danh từ hoặc động từ |
Dịch nghĩa:
Hình minh họa cho thấy số lượng điển hình của những người đi lại ở Vương quốc Anh sử dụng ba loại phương tiện giao thông khác nhau trong khoảng thời gian sáu mươi năm.
Không nghi ngờ gì, ô tô là lựa chọn được ưa chuộng nhất đối với người đi làm ở Anh. Mặc dù số người sử dụng ô tô và tàu hỏa tăng dần, nhưng số người đi xe buýt lại giảm đều đặn.
Năm 1970, khoảng 5 triệu người đi ô tô hằng ngày, trong khi hai phương tiện còn lại lần lượt được sử dụng bởi khoảng 4 triệu và 2 triệu người. Vào năm 2000, số người đi làm bằng ô tô tăng lên 7 triệu và số hành khách đi tàu hỏa đạt khoảng 3 triệu. Tuy nhiên, số người đi xe buýt giảm khoảng 0,5 triệu.
Đến năm 2030, số người đi làm bằng ô tô dự kiến sẽ đạt gần 9 triệu, và số hành khách đi tàu hỏa cũng được dự đoán sẽ tăng lên gần 5 triệu. Trong khi đó, số người đi xe buýt được dự báo sẽ giảm thêm, chỉ còn 3 triệu người đi lại.
Bài 2
The graph below shows the differences in wheat exports over three different areas.
Write a report for a university lecturer describing the information shown below.
Write at least 150 words.
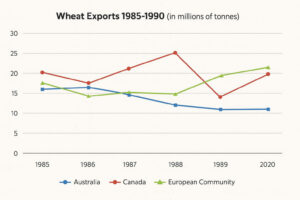
The line graph compares three regions (Australia, Canada, and the Euro Community) in terms of the volume of wheat exported annually over a period of six years, from 1985 to 1990.
Overvall, wheat exports from Canada showed the most noticeable fluctuations, peaking in 1988 before dropping sharpky. Meanwhile, the European Community witnessed a general increase, whereas Australia experienced a steady decline throughout the period.
As illustrated in the graph, the European Community’s figure started at just under 17 milion tons in 1985, slightly higher than Autralia, which exported about 15 milion tons, followed by a modest dip to roughly 16 milion tons in 1986. Then, it remained relatively stable until it rose significantly to over 20 milion tons in 1990. Regarding Canada’s exports, in 1985 they stood at approximately 19 milion tons of wheat. This figure saw a minor decline in 1986, but then their exports increased dramatically, hitting a peak of 25 milion tons in 1988. After that, the figure plummeted in 1989, but then subsequently rose again in 1990.
In constrast, the wheat exports from Australia displayed a consistent downward trend throughout the six-year period. In 1985, around 15 milion tons were exported, but this number slightly decreased in 1986. Then, the exports continued falling, reaching nearly 13 million tons in 1987 and 1988 before stabilizing and remaining flat in 1989 and 1990, hovering just above 11 million tons.
Tự vựng khó:
| Từ / Cụm từ | Giải thích | Dịch nghĩa tiếng Việt |
|---|---|---|
| compares | Examines the differences and similarities between things | So sánh |
| in terms of | Concerning, related to | Về mặt…, xét về… |
| volume of wheat exported | The amount of wheat sent to other countries | Khối lượng lúa mì xuất khẩu |
| annually | Every year | Hàng năm |
| period of six years | A time span of six years | Giai đoạn sáu năm |
| noticeable fluctuations | Clear or significant changes up and down | Sự biến động đáng chú ý |
| peaking | Reaching the highest point | Đạt đỉnh |
| dropping sharply | Falling quickly and strongly | Giảm mạnh |
| witnessed a general increase | Experienced an overall rise | Chứng kiến sự gia tăng chung |
| experienced a steady decline | Went down continuously and gradually | Trải qua sự suy giảm đều đặn |
| illustrated in the graph | Shown in the chart | Được minh họa trong biểu đồ |
| modest dip | A small decrease | Sự giảm nhẹ |
| remained relatively stable | Stayed almost unchanged | Duy trì tương đối ổn định |
| rose significantly | Increased a lot | Tăng đáng kể |
| approximately | About, nearly | Xấp xỉ |
| dramatically | Greatly, suddenly | Mạnh mẽ, đột ngột |
| hitting a peak | Reaching the highest point | Đạt mức cao nhất |
| plummeted | Fell suddenly and steeply | Giảm mạnh, lao dốc |
| subsequently | After that | Sau đó |
| in contrast | On the other hand, showing the opposite | Trái lại |
| displayed a consistent downward trend | Showed a regular decrease over time | Thể hiện xu hướng giảm liên tục |
| stabilizing | Becoming steady after changes | Ổn định trở lại |
| hovering just above | Staying around a bit higher than | Dao động ngay trên mức… |
Dịch nghĩa:
Biểu đồ đường so sánh ba khu vực (Úc, Canada và Cộng đồng châu Âu) về khối lượng lúa mì được xuất khẩu hàng năm trong giai đoạn sáu năm, từ 1985 đến 1990.
Nhìn chung, xuất khẩu lúa mì từ Canada có sự biến động đáng chú ý nhất, đạt đỉnh vào năm 1988 trước khi giảm mạnh. Trong khi đó, Cộng đồng châu Âu chứng kiến xu hướng tăng chung, còn Úc trải qua sự suy giảm đều đặn trong suốt giai đoạn này.
Như thể hiện trong biểu đồ, số liệu của Cộng đồng châu Âu bắt đầu ở mức gần 17 triệu tấn vào năm 1985, cao hơn một chút so với Úc, vốn xuất khẩu khoảng 15 triệu tấn, sau đó giảm nhẹ xuống còn khoảng 16 triệu tấn vào năm 1986. Tiếp theo, con số này giữ tương đối ổn định cho đến khi tăng đáng kể, vượt quá 20 triệu tấn vào năm 1990.
Về xuất khẩu của Canada, năm 1985 đạt khoảng 19 triệu tấn lúa mì. Con số này giảm nhẹ vào năm 1986, nhưng sau đó xuất khẩu tăng mạnh, đạt đỉnh 25 triệu tấn vào năm 1988. Sau đó, số liệu giảm mạnh vào năm 1989 nhưng tiếp tục tăng trở lại vào năm 1990.
Ngược lại, xuất khẩu lúa mì của Úc thể hiện xu hướng giảm liên tục trong suốt giai đoạn sáu năm. Năm 1985, khoảng 15 triệu tấn được xuất khẩu, nhưng con số này giảm nhẹ vào năm 1986. Sau đó, xuất khẩu tiếp tục giảm, xuống gần 13 triệu tấn vào các năm 1987 và 1988, trước khi ổn định và giữ nguyên trong các năm 1989 và 1990, dao động ngay trên mức 11 triệu tấn.
Bar Chart
Bài 1
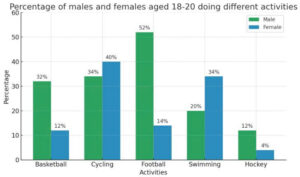
The bar chart shows the percentage of males and females aged 18–20 in a city who participated in various activities in one month in 2015. Summarise the information by selecting and reporting the main features, and make comparisons where relevant.
Mẫu 1:
The bar chart illustrates the participation rates of males and females aged 18 to 20 in a particular city, engaging in five distinct sporting and recreational activities over the course of one month in 2015.
It is evident that football attracted the highest proportion of male participants, while cycling was the most popular activity among females. Conversely, hockey registered the lowest engagement for both genders, highlighting its relatively limited appeal within this demographic.
When examining cycling and swimming, which were more polular among females the difference is particularly notable in swimming. While the proportion of women who cycled stood at around 40%, slightly exceeding the male figure of approximately 35%, swimming displayed a sharper contrast. Roughly 35% of females participated in swimming, compared to only one-fifth of their male counterparts. This suggests that women in this age group tended to favour these activities, possibly due to social or recreational preferences that differ from those of men.
By contrast, basketball and football were predominantly male-oriented activities. Approximately 30% of young men played basketball triple the female participation rate indicating a marked gender disparity. Football exhibited the greatest gap, with over half of males taking part, whereas only about 15% of females did so. Hockey, on the other hand, remained the least favoured option overall, attracting merely around 10% of men and fewer than 5% of women, which underlines its relatively minor role in the sporting habits of this age group.
Từ vựng khó và giải thích:
| Từ vựng | Nghĩa tiếng Việt | Ghi nhớ nhanh |
|---|---|---|
| illustrates | minh họa, mô tả | “illustrate” = show with details or examples |
| participation rates | tỷ lệ tham gia | “participation” = sự tham gia |
| distinct | khác biệt, riêng biệt | khác hẳn nhau, rõ ràng |
| recreational activities | hoạt động giải trí | “recreation” = leisure activities |
| proportion | tỷ lệ | gần nghĩa với “percentage” |
| Conversely | ngược lại | dùng để so sánh đối lập |
| engagement | sự tham gia, sự gắn kết | ở đây = mức độ tham gia |
| relatively | tương đối | dùng khi so sánh nhẹ |
| demographic | nhóm dân số, nhân khẩu | nhóm người theo độ tuổi, giới tính… |
| examining | xem xét, phân tích | từ gốc “examine” |
| notable | đáng chú ý | tương tự “remarkable” |
| slightly | hơi, một chút | mức độ nhẹ |
| counterparts | đối tác tương ứng / cùng nhóm | ở đây: nhóm nam tương ứng với nữ |
| favor / favour | ưa thích | Anh-Mỹ = favor, Anh-Anh = favour |
| predominantly | chủ yếu | mainly |
| triple | gấp ba lần | three times as much |
| disparity | sự chênh lệch | thường dùng trong “income disparity” |
| favored / favoured | được ưa chuộng | tương tự “preferred” |
| merely | chỉ, đơn thuần | slightly formal |
| underlines | nhấn mạnh, làm rõ | tương tự “emphasizes” |
Dịch nghĩa:
Biểu đồ cột minh họa tỷ lệ tham gia của nam và nữ trong độ tuổi từ 18 đến 20 tại một thành phố, tham gia vào năm hoạt động thể thao và giải trí khác nhau trong vòng một tháng vào năm 2015.
Có thể thấy rằng bóng đá thu hút tỷ lệ nam giới tham gia cao nhất, trong khi đạp xe là hoạt động phổ biến nhất đối với nữ giới. Ngược lại, khúc côn cầu ghi nhận mức độ tham gia thấp nhất ở cả hai giới, cho thấy sức hấp dẫn tương đối hạn chế của môn thể thao này trong nhóm dân số này.
Khi xem xét hoạt động đạp xe và bơi lội, vốn phổ biến hơn đối với nữ giới, sự khác biệt đặc biệt rõ ràng ở môn bơi. Trong khi tỷ lệ phụ nữ tham gia đạp xe ở mức khoảng 40%, cao hơn một chút so với nam giới (khoảng 35%), thì bơi lội thể hiện sự chênh lệch lớn hơn. Khoảng 35% nữ giới tham gia bơi, so với chỉ một phần năm nam giới cùng độ tuổi. Điều này cho thấy phụ nữ trong nhóm tuổi này có xu hướng ưa chuộng các hoạt động này hơn, có thể là do sở thích xã hội hoặc giải trí khác biệt so với nam giới.
Ngược lại, bóng rổ và bóng đá lại là những hoạt động chủ yếu dành cho nam giới. Khoảng 30% nam thanh niên chơi bóng rổ, gấp ba lần tỷ lệ nữ giới tham gia, cho thấy sự chênh lệch giới tính rõ rệt. Bóng đá thể hiện khoảng cách lớn nhất, với hơn một nửa nam giới tham gia, trong khi chỉ khoảng 15% nữ giới làm điều đó. Trong khi đó, khúc côn cầu vẫn là lựa chọn ít được ưa chuộng nhất, chỉ thu hút khoảng 10% nam giới và chưa đến 5% nữ giới, điều này nhấn mạnh vai trò khá nhỏ của môn thể thao này trong thói quen thể thao của nhóm tuổi này.
Mẫu 2:
The bar chart gives information about the proportion of both genders between 18 and 20 participating in five different sport in one month in 2015.
Overall, it is clear that basketbakk, football and hockey were more cycling among men than women, while the opposite was true for cycling and swimming. In addition, football was the most popular activity among males, while cycling attracted the highest proportion of females.
Looking at the details/ looking more closely, cycling and swimming showed a clear female preference. About 40% of women participated in cycling, sightly higher than the male figure of around 35%. Swimming displayed a more notable gap, with roughly 35% of females taking part compared to only 20% of males. This indicates that women in this age group tended to be more engaged in these two activities than their male counterpairts.
In contrast, basketball and football were dominated by male participants. Approximately 30% of young men played basketball, double the proportion of females. Football recorded the largest disparity, with over half of male engaging in the sport, compared to only about 15% of females. Hockey was the least popular activity overall, with participation rate of around 10% for men and under 5% for women.
Dịch nghĩa:
Biểu đồ cột cung cấp thông tin về tỷ lệ nam và nữ trong độ tuổi từ 18 đến 20 tham gia vào năm môn thể thao khác nhau trong vòng một tháng của năm 2015.
Nhìn chung, có thể thấy rằng bóng rổ, bóng đá và khúc côn cầu phổ biến ở nam giới hơn nữ giới, trong khi điều ngược lại đúng với môn đạp xe và bơi lội. Ngoài ra, bóng đá là hoạt động phổ biến nhất trong nam giới, trong khi đạp xe thu hút tỷ lệ nữ giới tham gia cao nhất.
Xem xét chi tiết hơn, đạp xe và bơi lội cho thấy sự ưa thích rõ rệt từ phía nữ. Khoảng 40% phụ nữ tham gia đạp xe, cao hơn một chút so với nam giới, khoảng 35%. Bơi lội thể hiện khoảng cách lớn hơn, với khoảng 35% nữ giới tham gia so với chỉ 20% nam giới. Điều này cho thấy phụ nữ trong nhóm tuổi này có xu hướng tham gia nhiều hơn vào hai hoạt động này so với nam giới cùng độ tuổi.
Ngược lại, bóng rổ và bóng đá chủ yếu do nam giới tham gia. Khoảng 30% nam thanh niên chơi bóng rổ, gấp đôi tỷ lệ nữ giới. Bóng đá ghi nhận sự chênh lệch lớn nhất, với hơn một nửa nam giới tham gia môn thể thao này, so với chỉ khoảng 15% nữ giới. Khúc côn cầu là môn thể thao ít phổ biến nhất nhìn chung, với tỷ lệ tham gia khoảng 10% ở nam và dưới 5% ở nữ.
Bài 2
You should spend about 20 minutes on this task.
The bar chart shows the literacy rate (% of people who can read and write) by region and gender in 2011.
Summarise the information by selecting and reporting the main features, and make comparisons where relevant.
Write at least 150 words.
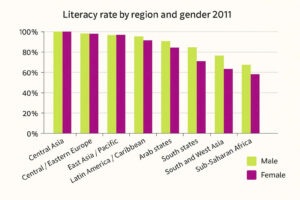
The bar chart compares the proportion of literate individuals, referring to those who can read and write, by gender across various global regions in the year 2011,
Overall, it is clear that male literacy rates were consistently higher than female literacy rates across all regions in 2011, with the most significant gender gaps abserved in South and West Asia and Sub Saharan Africa. In contrast, regions such as Central Asia, East Asia and the Pacific, and Central and Eastern Europe reported minimal differences between male and female literacy rates.
Looking more closely, Central Asia and East Asia and the Pacific reached nearly full literacy for both genders, approaching 100 percent. Central and Eastern Europe, along with Latin America and the Caribbean, also demonstrated high reading and writing proficiency, with male and female rates both exceeding 90 percent.
On the other hand, in the Arab States, males had a literacy rate above 90 percent, while females were notably lower, around 75 percent. A more striking disparity was seen in South and West Asia where approximately 80 percent of males were literate compared to only 60 percent of females. Sub-Saharan Africa showed the lowest figures overall, particularly for women, whose literacy rate stood just above 50 percent, whereas men reached about 70 percent.
Từ vựng khó:
| Từ / Cụm từ | Giải thích | Dịch nghĩa tiếng Việt |
|---|---|---|
| compares | Examines similarities and differences | So sánh |
| proportion | The percentage or part of a whole | Tỷ lệ, phần trăm |
| literate individuals | People who can read and write | Người biết đọc biết viết |
| across various global regions | In many different parts of the world | Trên nhiều khu vực toàn cầu |
| consistently | Happening in the same way over time | Liên tục, nhất quán |
| gender gaps | Differences between males and females | Khoảng cách giới tính |
| observed | Noticed, recorded | Được ghi nhận / quan sát thấy |
| minimal differences | Very small variations | Sự khác biệt nhỏ |
| proficiency | High level of skill or ability | Trình độ thành thạo |
| notably lower | Significantly less | Thấp đáng kể |
| striking disparity | A very noticeable difference | Sự chênh lệch rõ rệt |
| approximately | About, nearly | Xấp xỉ, khoảng |
| figures overall | The data as a whole | Số liệu tổng thể |
| stood just above | Was slightly higher than | Đứng ngay trên mức |
Dịch nghĩa:
Biểu đồ cột so sánh tỷ lệ người biết chữ, tức những người có khả năng đọc và viết, theo giới tính ở các khu vực khác nhau trên thế giới vào năm 2011.
Nhìn chung, có thể thấy rằng tỷ lệ biết chữ của nam giới luôn cao hơn nữ giới ở tất cả các khu vực vào năm 2011, với khoảng cách giới tính lớn nhất được ghi nhận ở Nam – Tây Á và khu vực cận Sahara châu Phi. Ngược lại, các khu vực như Trung Á, Đông Á và Thái Bình Dương, cùng với Trung và Đông Âu, cho thấy sự khác biệt rất nhỏ giữa tỷ lệ biết chữ của nam và nữ.
Xem xét kỹ hơn, Trung Á và Đông Á – Thái Bình Dương đạt gần như mức biết chữ hoàn toàn cho cả hai giới, tiến sát 100%. Trung và Đông Âu, cùng với Mỹ Latinh và Caribe, cũng thể hiện trình độ đọc và viết cao, với tỷ lệ nam và nữ đều vượt quá 90%.
Ngược lại, tại các quốc gia Ả Rập, tỷ lệ biết chữ của nam giới trên 90%, trong khi nữ giới thấp hơn đáng kể, chỉ khoảng 75%. Một sự chênh lệch rõ rệt hơn được ghi nhận ở Nam – Tây Á, nơi có khoảng 80% nam giới biết chữ so với chỉ 60% nữ giới. Khu vực cận Sahara châu Phi cho thấy số liệu thấp nhất nói chung, đặc biệt là đối với nữ giới, với tỷ lệ biết chữ chỉ nhỉnh hơn 50%, trong khi nam giới đạt khoảng 70%.
Bài 3
Essay: Fitness Centre Participation by Age Groups
The bar chart illustrates how participation at the Fundanmetal Fitness Centre changed among three different


You May Also Like

Git & GitHub: Từ lịch sử hình thành đến hướng dẫn sử dụng chi tiết cho người mới bắt đầu

HÀNH TRÌNH VIẾT CHUYÊN ĐỀ – KHÓA LUẬN TỐT NGHIỆP | NHỮNG ĐIỀU MIMI ƯỚC GÌ MÌNH BIẾT TỪ SỚM